a blue background with lines and dots

Data Analytics projects
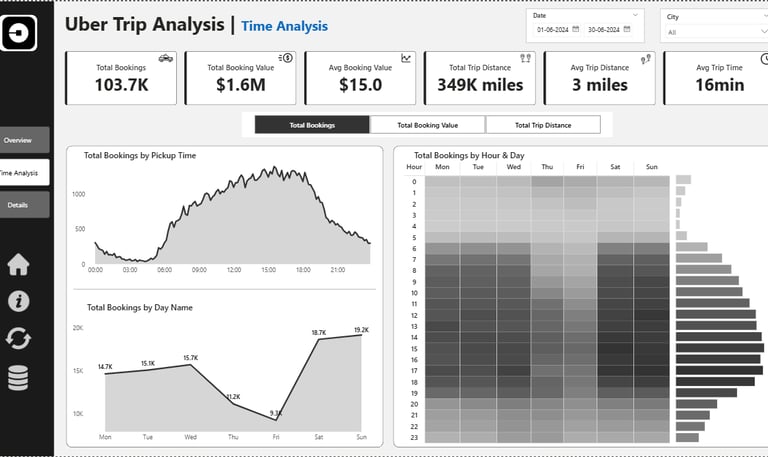
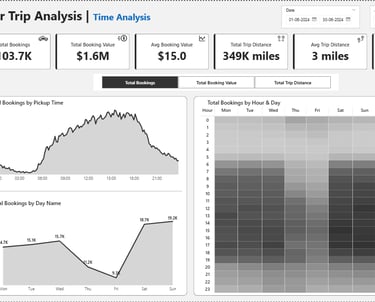
Uber Trip Analysis

This Uber Trip Analysis dashboard provides insights into 103.7K bookings, highlighting trip value, distance, time, and payment modes. It identifies peak booking days across 7 days,, preferred vehicle among 5 different types, and popular pickup/drop-off locations across 2400 hrs. Key metrics like average trip duration and farthest trips enhance decision-making and analyze customer preference trends.

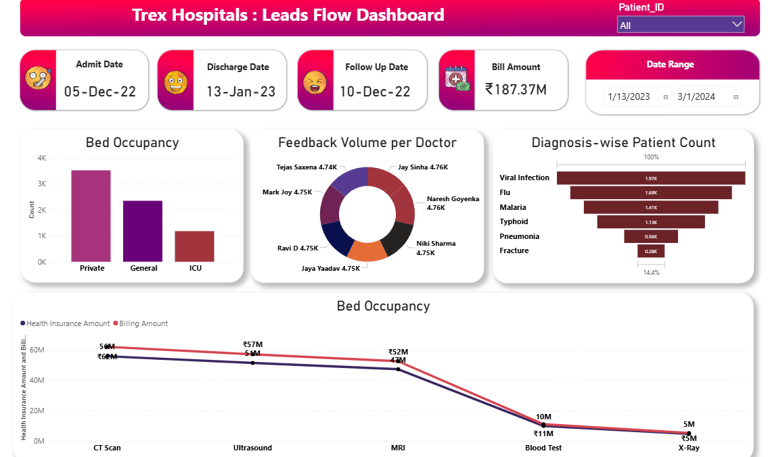
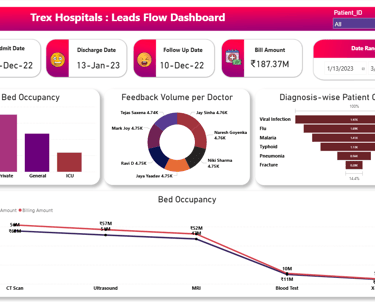
Trex Hospital Data Analysis

Built an interactive hospital dashboard to track patient flow, billing (₹187.37M), and diagnosis trends. Visualized bed occupancy (3.5K private beds), feedback (~4.75K per doctor for 8 doctors), and disease-wise patient counts (1.97K viral cases). Compared billing vs. insurance across procedures like CT, MRI, X-Ray, enhancing decision-making and insights.

a blue background with lines and dots

AI and ML projects

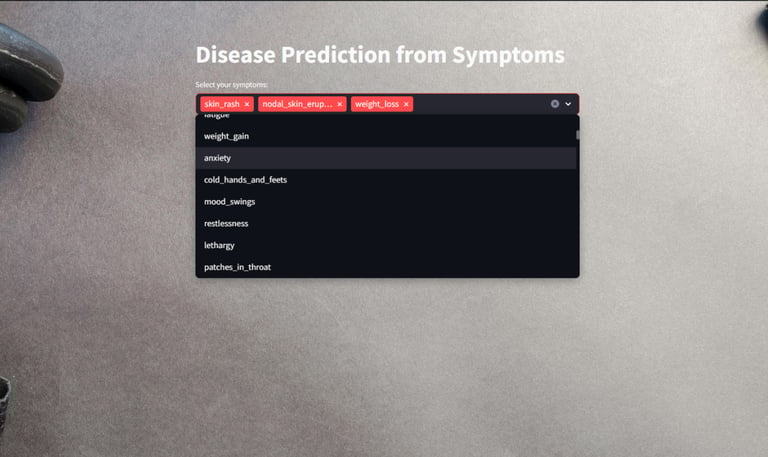
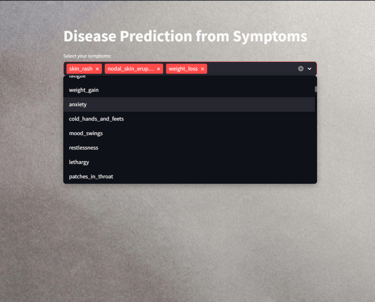
Symptom-based Medical Recommendation Model

The Medical Recommendation System is an AI-driven healthcare model designed to predict diseases based on user-inputted symptoms and provide relevant medical recommendations. The system employs a Support Vector Classifier (SVC) to classify diseases accurately and suggests medications, dietary plans, and workout routines. It has an accuracy of 100 percent.
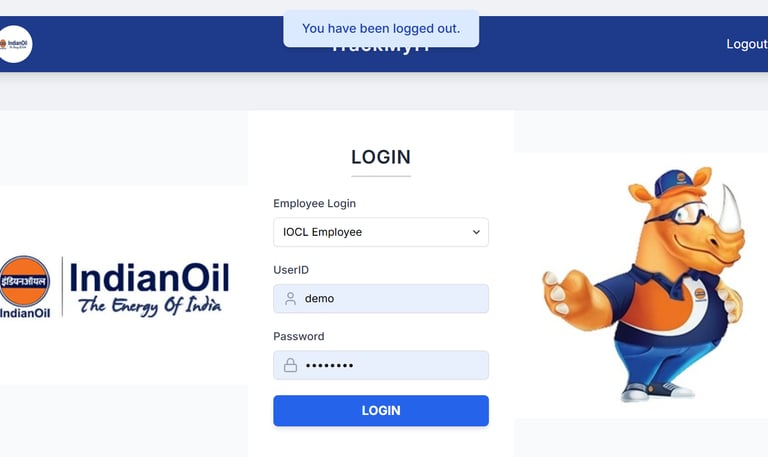
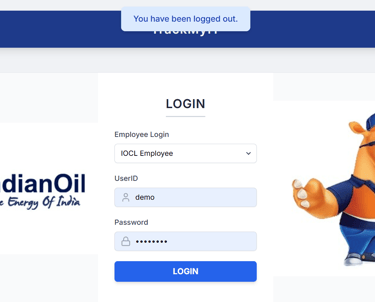
Track with IT

Developed a full-stack IOCL Asset Management web application using Flask, HTML, CSS, and JavaScript to streamline asset tracking, location-wise data management, and reporting. Integrated dynamic Excel data loading and real-time filtering, enabling efficient asset visibility and search functionality across 1000 plus IOCL locations transferring 10 plus different kinds of assets

A person is holding a smartphone displaying an analytics or insights screen with various metrics and numbers. The individual is wearing a casual white shirt and a watch with a black band. The surrounding environment includes an indoor plant.

Gallery

Showcasing my projects in data analytics, AI, and ML.

A person is viewing a map with red data points on a computer monitor, likely indicating a geographical distribution. The image has a focus on technology and data analysis.
A smartphone displays analytics data with graphs showing views, downloads, and likes. It is resting vertically on a white dock next to a small potted succulent plant. In the background, a large computer monitor is partially visible, along with a closed laptop and a white wireless earbud case.
woman wearing yellow long-sleeved dress under white clouds and blue sky during daytime

Arkaprabha's analytical skills transformed our data into actionable insights, driving our project success significantly.

A person with a striped shirt and a cap is standing in front of a computer screen displaying data and analytics. Another laptop is open on a desk below the monitor, and a large metallic tank with a pressure gauge is nearby.

Working with Arkaprabha was a game-changer; their expertise in AI and ML is truly impressive.

A computer screen displaying a coding interface with Python code related to machine learning. The code imports libraries like sklearn and deals with model metrics such as precision and recall. A classification report is shown along with a section titled 'Different meta model trained' listing various models like DT, RF, LR, and XGB. Below, there is code for tuning an XGB model using GridSearchCV.
★★★★★
★★★★★